As competition has grown over the last few years, it has been increasingly important to test the creativity on your product detail pages to maximize conversions for your products on Amazon.
This testing requires that you understand how Amazon calculates conversion rates and where to find the data.
Amazon provides a few ways to monitor your listings’ conversion rate. Monitoring your conversion rate on Amazon can help you to:
- Identify de-indexing events.
- Assess the effectiveness of your advertising targeting.
- Verify listing changes have improved conversion.
Tracking your conversion rate helps you better understand how changes you have made to your listing – or changes to the marketplace – have affected your sell-through rate.
While Amazon looks like one cohesive marketplace on the outside, it is made of much smaller platforms on the back end.
Depending on the type of physical product you are selling, your listing might be on:
- Amazon Seller Central.
- Amazon Vendor Central.
- Amazon Kindle Direct Publishing (KDP).
- Merch by Amazon.
- Amazon Handmade.
Amazon only provides conversion rate data on a few of its selling platforms.
It is not currently possible to get an exact conversion rate from a product you are not currently selling on Amazon.
Are There External Tools I Can Use To Find My Conversion Rate?
There are many tools on the market that provide sales volume estimators.
These tools generally look at the sales rank of an item along with the category of the product.
The tools then estimate how much a product sells based on an estimation of sales for that sales rank and sub-category.
Often, these tools can be off by incredibly high margins.
In this article, you will learn how to find your conversion rate on a few popular platforms for sellers on Amazon.
We will share instructions on which platforms you can find your conversion rates and where to locate the data.
Finding Your Conversion Rate On Seller Central
If you sell your product on Amazon Seller Central, getting your conversion rate is quick and easy.
To find your conversion rate, log into your Seller Central account.
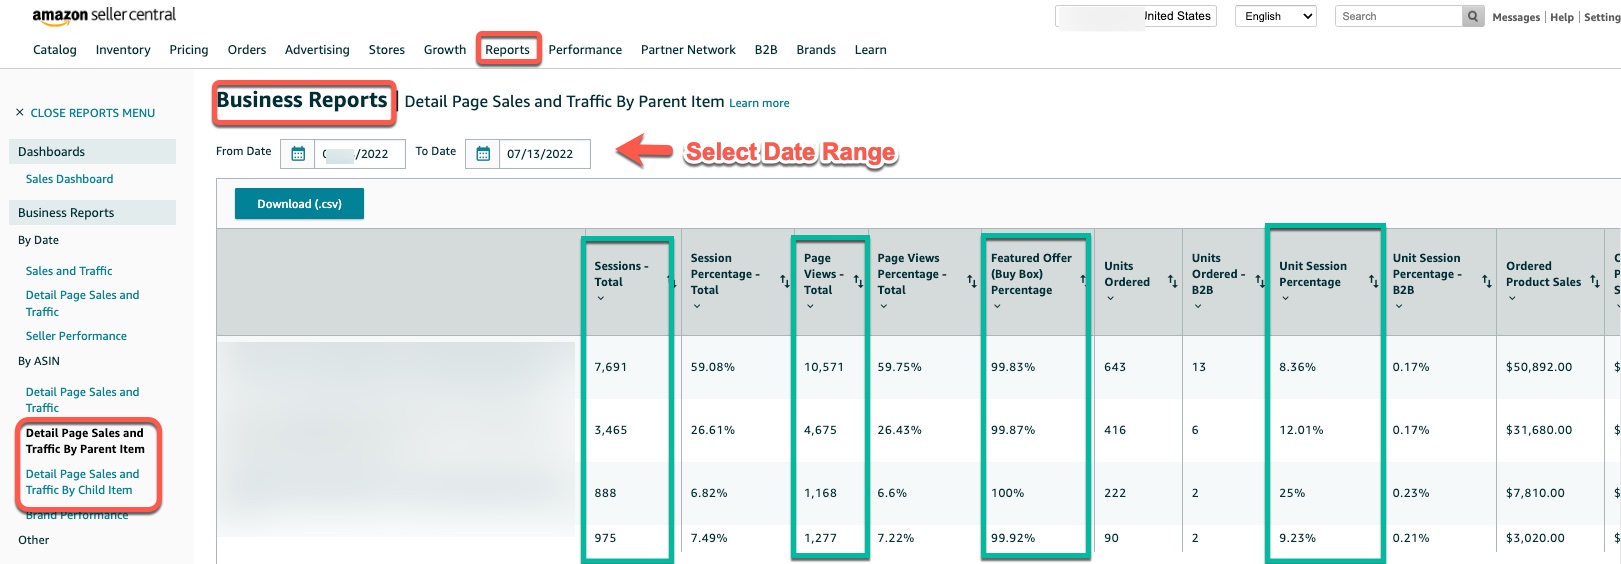
Then, navigate the top menu bar to Reports > Business Reports > Detailed Page Sales and Traffic Reports by Child Item.
(If you want to look at all of your variations (size, color, flavor) together, you can also navigate to Reports > Business Reports > Detailed Page Sales and Traffic Reports by Parent)
In this downloadable report, you can discover a lot of valuable information on the traffic and sales of your product on Amazon.
Here is a list of the information available in this report and what it tells you about your products.
Understanding The Detailed Page Sales & Traffic Report
The Detailed Page Sales and Traffic Report provides valuable information on traffic, Buy Box percentage, and Amazon Business sales.
Here is a little more about a few data points available in this report.
The Detailed Page Sales and Traffic Report is a date range report; you select the period you would like measured. The report defaults to a period of the last 30 days.
In the following definition, the statements about quotes are directly from Amazon’s descriptions of each report field.
 Screenshot from sellercentral.amazon.com; modified by author, July 2022
session
“Sessions are visits to your Amazon.com pages by a user. All activity within 24 hours is considered a session.”
If a customer comes to your product detail page, then goes to review another product, and finally returns to your product, that is one session and two page views for your product detail page.
Page Views and Sessions are global numbers. Even if you are out of stock, you will still see the total number of Page Views and Sessions on that Product Detail Page.
page views
“Hits in your Amazon.com presence for the selected time period.”
Page views are as described: it measures the number of page views this product has had during the date range you have set for the report.
Buy box percentage
“This is the percentage of page views where the buy box (the ‘add to shopping cart’ link) appeared on the page for customers to add your product to their cart.”
Understanding your Buy Box Percentage is vital to running ads or diagnosing sell-through rate issues.
For Sponsored Product Ads, your product must have the Buy Box for your ads to appear.
It is possible to have a 0% Buy Box percentage even if you are the only seller if you have a suppressed Buy Box due to pricing issues or brand health alert.
Brand Health alerts generally mean that Amazon has found your item at a lower price on a big website like Walmart, Home Depot, Lowes, Target, etc.
Unit session percentage
“Percentage conversion metric indicating how many units were purchased relative to the number of people who viewed the products.”
The unit session percentage is your conversion rate for that product.
You can pull this report retroactively to verify if your changes to a listing have helped the conversion rate over time.
Finding Your Conversion Rate On Vendor Central
Previously, you needed ARA Premium to find your conversion rate. However, that has changed.
Finding your conversion rate on Vendor Central is just as easy as finding your conversion rate on Seller Central.
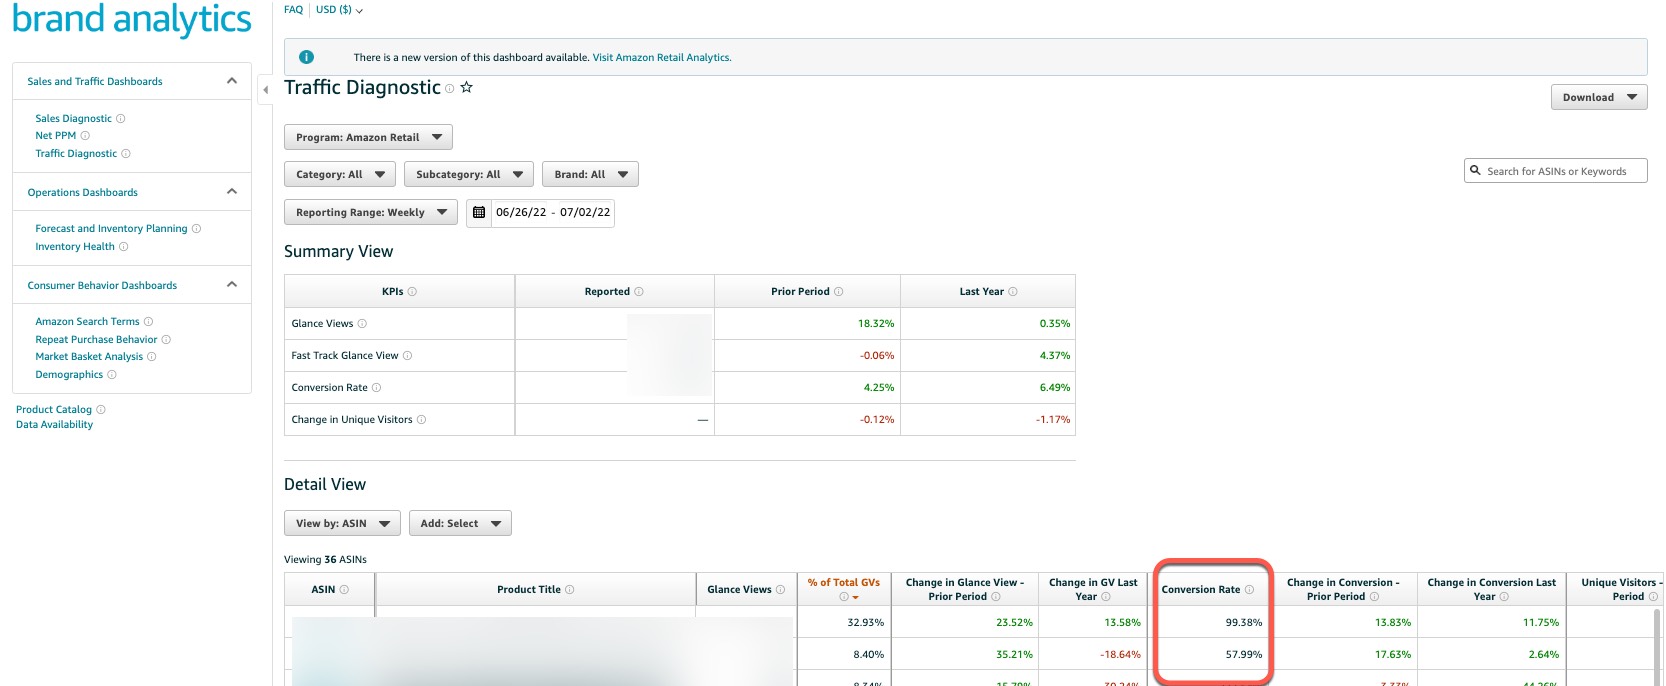
In Vendor Central, you will go to Reports, Analytics, then Traffic Diagnostics.
 Screenshot from vendorcentral.amazon.com, July 2022
In addition, the Traffic Diagnostics Report gives you a comparison of your conversion rate compared to previous time frames.
Here you can see your change in overall conversions for a date range, or you can view your change in conversion rate by ASIN.
This report allows you to track changes in the conversion of your products over time. You can select the report range of daily, weekly, monthly, quarterly, or yearly.
Finding Your Conversion Rate On Other Amazon Platforms
The same page view and conversion data on Seller Central and Vendor Central are unavailable for the KDP platform. The KDP platform hosts Kindle and CreateSpace books on Amazon or Merch by Amazon, which provides print-on-demand t-shirts and similar merchandise.
If you are an author looking to understand the conversion rates better, you have a few additional options.
Penny C. Sansevieri, CEO and founder of Author Marketing Experts, Inc, explained:
“The most basic and obvious way to check sales is, of course, book sales. But there is also your Amazon bestseller status/rank within Amazon overall, and within each specific genre/category you are showing up in. That is a good way to see a spike in sales and/or page reads.
But keep in mind that the higher your sales rank, the less frequently your rank is updated. This means that if your sales rank is 475,000, your rank only gets updated once or twice daily; if you are at 27,000, it is updated hourly.
So, the lower your number, the more frequently you will see movement.”
Another option (if you have a physical book listed on Amazon’s KDP platform) is to open a Seller Central account and add the physical book to your inventory on Seller Central.
You will then be able to access the Detailed Page Sales and Traffic Report and the page views and sessions for that product page.
You can then manually calculate your conversion rate by taking the number of sessions divided by the number of units you sold during that period.
If you are selling on Merch by Amazon, there is currently no way for you to get access to data to calculate your conversion rate.
What Is A Good Conversion Rate On Amazon?
The next logical consideration after knowing how to locate your conversion rate for your products on Amazon is to want to evaluate your product performance against a benchmark or standard.
When looking at conversion rates for products on Amazon, one of the most significant factors is competitiveness.
For example, we would expect a cellphone case to typically have a much lower conversion rate than a more niche product.
Sometimes, an artificially high conversion or unit session percentage can indicate that you have a traffic problem.
We had a client that came to us for help with their Amazon sales. They were not getting the sales they needed on the platform.
When we looked at their Unit Session Percentage, it was well over 80%. However, the traffic they were getting to that listing was less than 400 visitors a week.
Upon further investigation, we found that their listing was only indexed for their brand name.
Re-optimizing their listing and beginning advertising on Amazon, we were quickly able to make a sharp increase in their traffic and sales, even though this lowered the Unit Session percentage rate on their product.
Considering Unit Session % In Your Advertising On Amazon
Previously, the benchmark for a good Unit Session % or conversion rate was around 20%.
In March 2020, there was a sudden drop in conversion rates across almost all verticals and products.
Amazon has said that this is due to them adding mobile data into the conversion rates. For most products, conversion rates were almost cut in half.
After this change, I recommend you aim for 7-15%.
If you have brand affinity around your products, meaning people are searching by your brand or product name to find you, we would want to see closer to 12-15% as a baseline.
We manage several accounts with an average of over 20% at a high sales velocity. These brands tend to have loyal repeat customers and strong brand affinity.
If you are a private label brand with no brand affinity, a unit session of 7% or more is what we would consider good in most categories.
If your conversion is less than this, we first recommend seeing if you can increase your conversion percentage.
You can start this by looking at potentially re-optimizing your Amazon product detail page.
If that is not possible, you will want to make sure you are adjusting as you optimize your bids for Amazon.
Conversion Data Can Impact Your Entire Sales Cycle
Your product conversion rate on Amazon can affect your sales cycle, organic ranking, and how your ads appear.
Use your conversion rate to monitor how changes to your product listings have affected your sales and new competition in the marketplace.
Then, apply your conversion data to benchmark product and marketplace changes.
This data will help you optimize your listing for better sales and results from product advertising.
More resources:
Featured Image: David Gyung/Shutterstock
Follow us on Facebook | Twitter | YouTube
WPAP (907)


